

vChart 2.9.25
افزونه vChart یکی از پیشرفته ترین کامپوننت های جوملا جهت نمودارسازی اطلاعات می باشد. این افزونه بسیار کاربری ساده ای ردارد و دارای انواع نمودارها می باشد که لیست آن را در زیر می بینید:
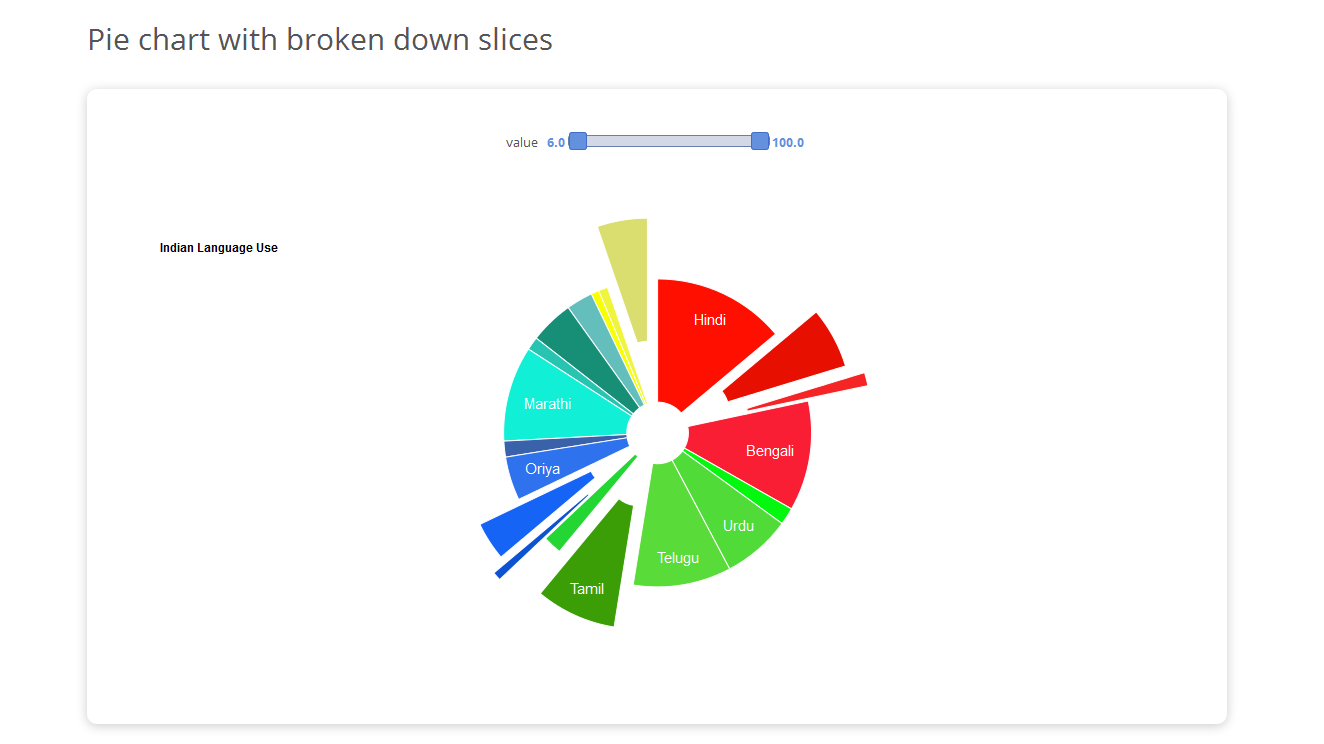
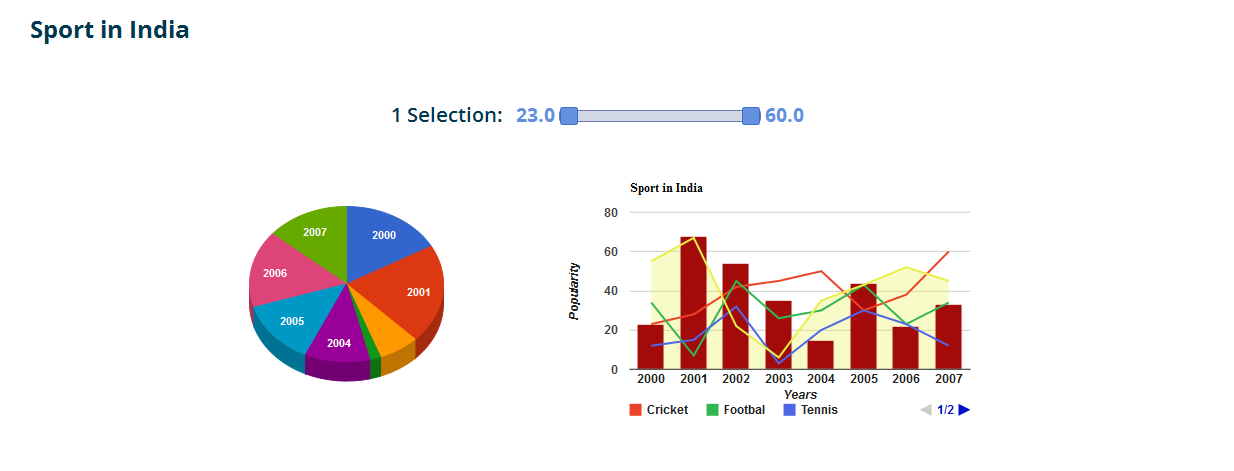
Line Chart, Area Chart, Stepped Area Chart, Timeline Chart, Column Charts, Combo Charts, Annotation chart, Geo Charts, Maps Charts, Candlestick Charts, Table, Scatter Chart, Gauge, Bubble Chart, Pie Charts, Slice Pie Charts
به راحتی می توانید نمودارها را در موقعیت های ماژول ها و در مطالب قرار دهید. و همچنین می توانید داده های نمودارها را به صورتی دستی یا از فایل CSV یا دیتابیس سایت خود و یا سایت های دیگر وارد آن کنید. این افزونه بر اساس کتابخانه نمودار گ.گل می باشد.

Why vChart?
- One stop for all your data Visualization needs.
- Every possible chart by Google API and beyond your imagination formatting options.
- Absolutely dynamic chart- Picks data continuously from dynamic csv getting data from external source.
- Zero proficient user friendliness- Data can be picked from n number of tables through SQL queries and even through in-depth filters which makes it easier to use for a new user or beginner.
- Smart Chart concept- Facilitated with options to present single chart graphically at different pages based on current page dynamic variable.
vChart Scope
This tool is of best use to people from various Business areas. Few of them are listed below..
Corporate purposes:- Make online Charts for your staff training and other corporate sections example. Growth, Loss, Income and expenses etc.
Stock Market or Equity Market:- It plays a vital role in Stock Market for Live trading statistics, Currency fluctuation, Sell stocks, Prices conversion rate etc.
Financial System:- Reporting and tracking the market targets of companies is best managed by creating graphs and charts to visualize data and comprehend statistics.
E-Learning:- Charts have the power to enhance the interactivity of eLearning courses.
Brand promotion:- Increase popularity of your brand entertaining your site visitors. To do that, just create the engaging online Charts for Joomla! And launch a challenging competition.
vChart package contains 1 Component, 1 Module & 1 Plugin:
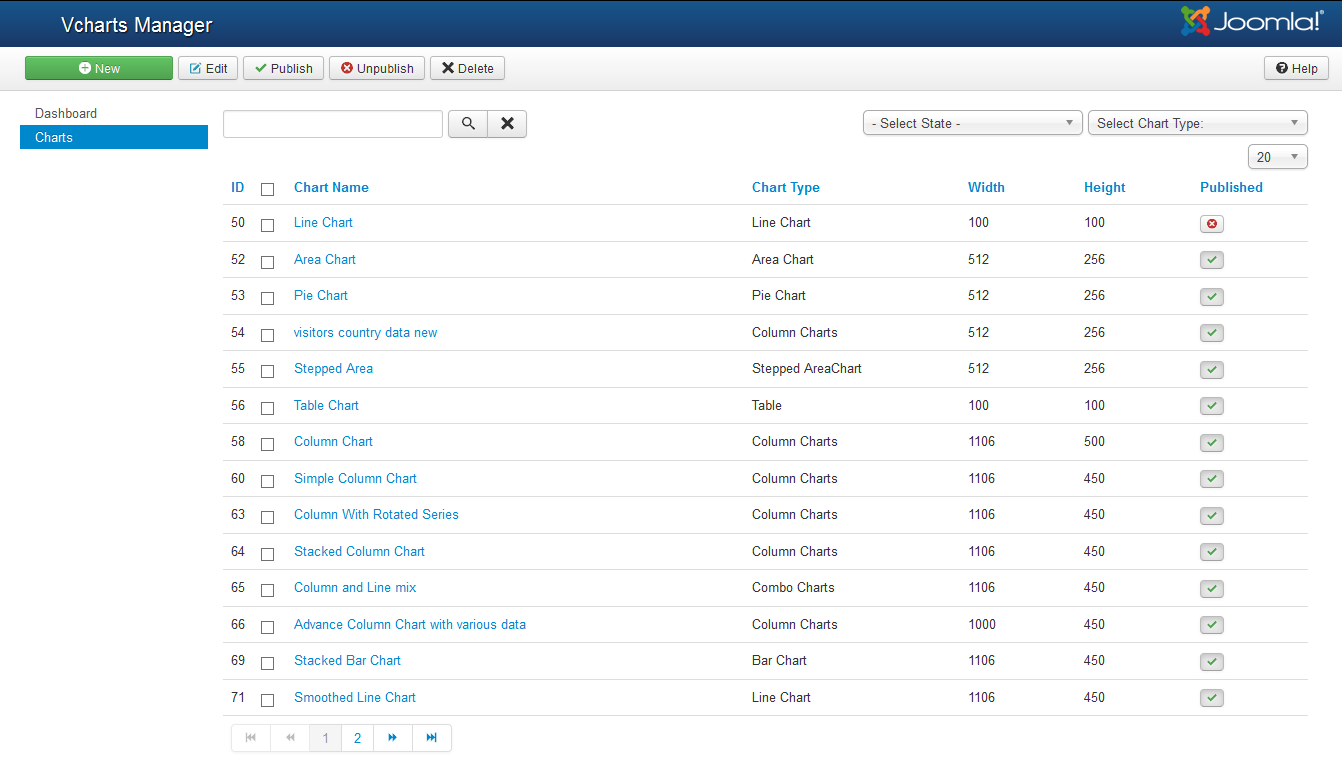
vChart Component:- This is the main extension. Other extensions are dependent on this.
vChart Module:- Allows you to display ‘n’ no of Charts on a single page with different modules.
vChart Content Plugin:- You can also embed Charts in Articles, K2 Items and other Content Items using Keyword {vchartmodule,ChartId}.
Most Sparkling Features:
- vChart is built using HTML5, to provide cross-browser compatibility and cross platform portability to all mobile devices example. iPhones, iPads, and Android etc.
- Allows you to create several types of charts with different data set combination.
- Allows you to select any existing database table where you can select any column for creating different Charts.
- Allows you to write custom MySql queries to fetch data in order to generate charts.
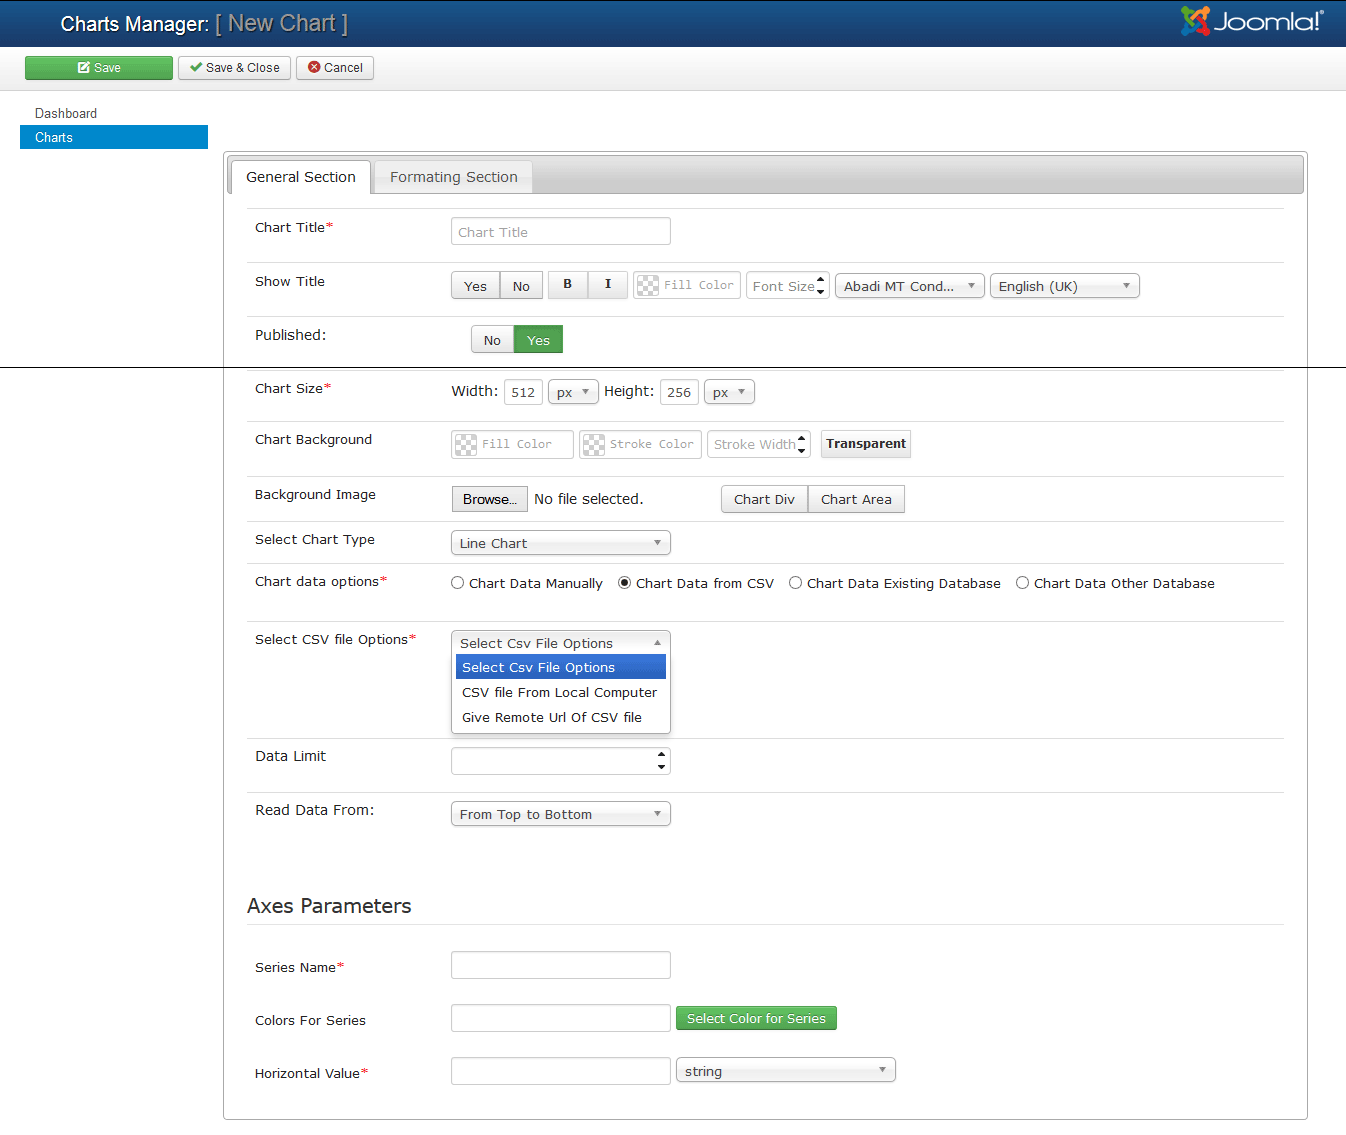
- Allows bulk import of charts data into any existing Chart from CSV File, stored on your local computer.
- Allows to import charts data from "CSV-File-URL", stored on remote server.
- Can quickly copy an existing Chart to make a new Chart with some modifications.
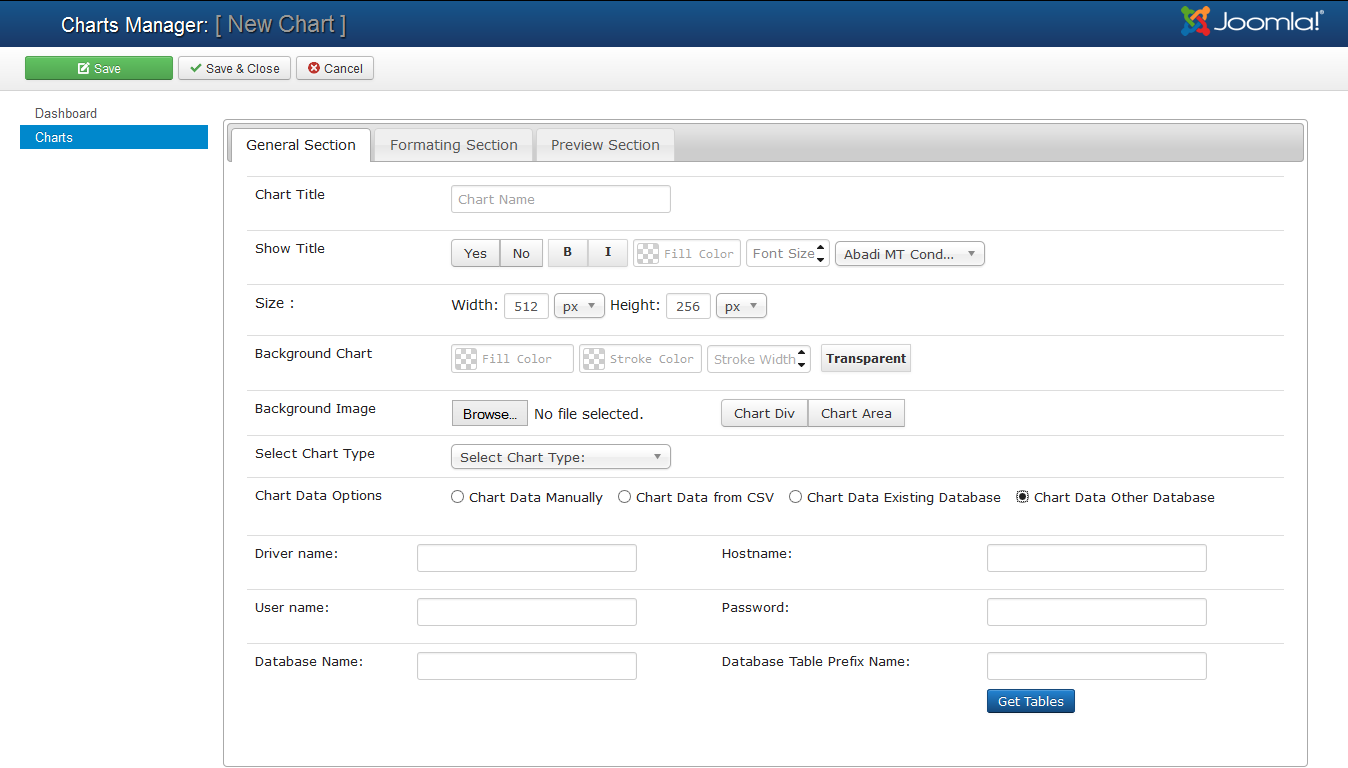
- Allows you to connect any external database and there you can select any column for different Charts parameters from that table.
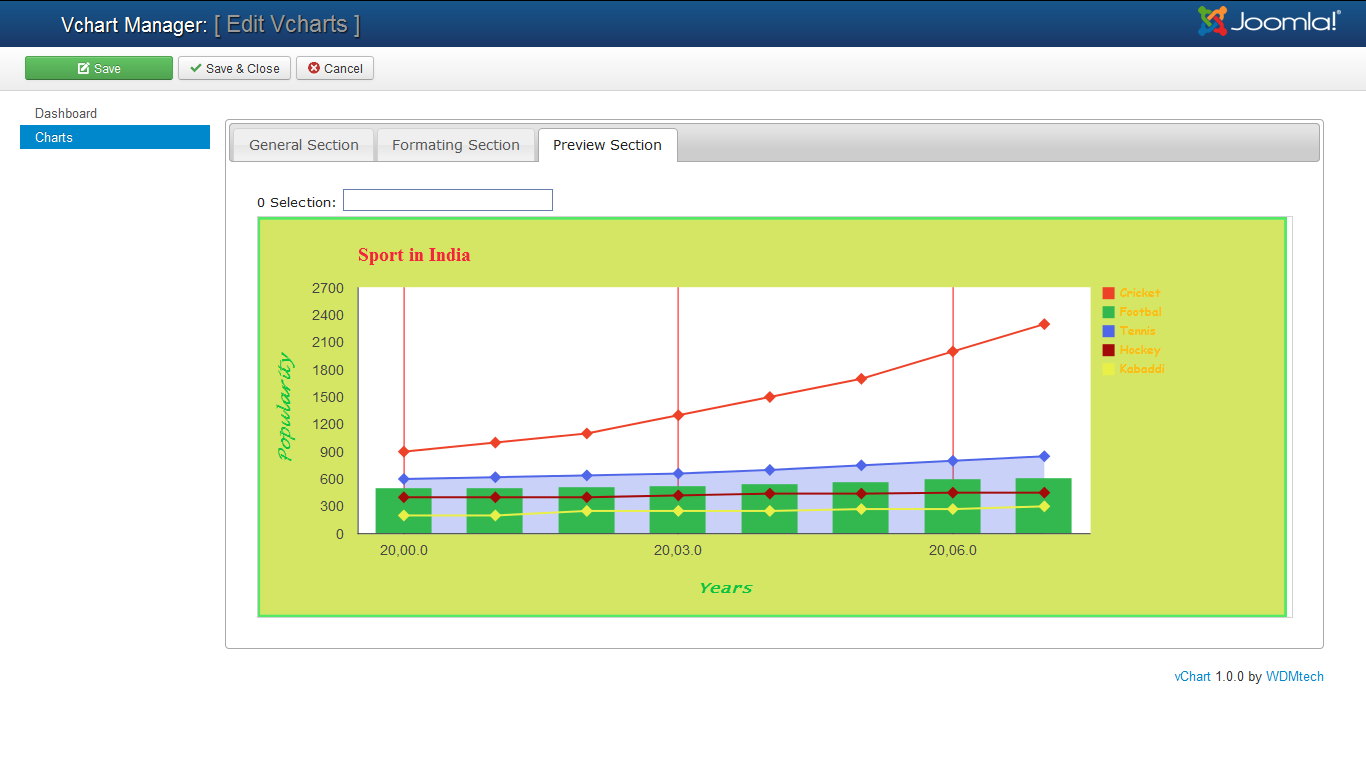
- Provides you an option for Chart preview at backend before publishing at front end.
Main Features List:
- RTL compatible.
- Very flexible and fully responsive.
- User friendly UI (User interface) and very easy data input methods.
- Different advance formatting parameters based on Chart Types.
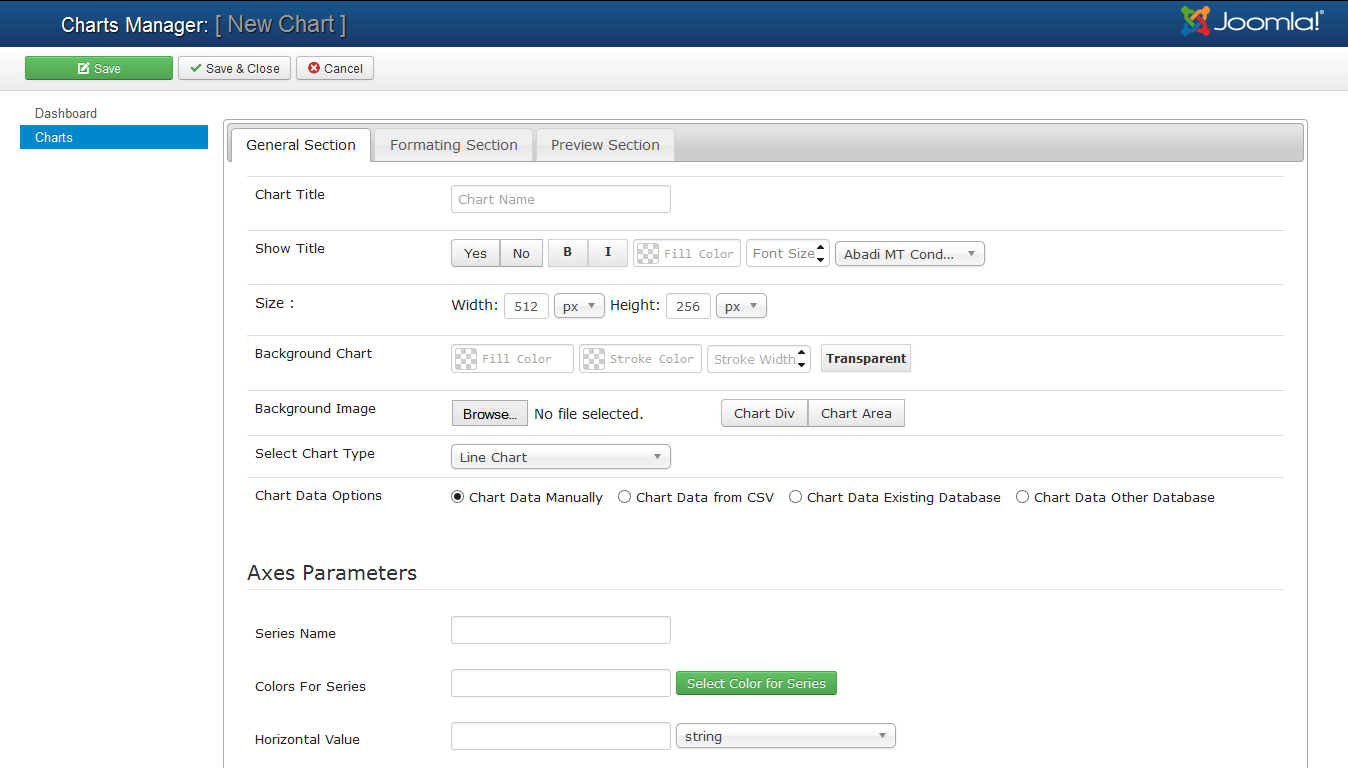
- Ability to add various control parameters on Chart Title example Hide, Show, Bold, Italic, Fonts, Font Size etc.
- Modes of input for Chart Width and Height a) Pixel and b) Percentage.
- Ability to add various control parameters on Chart Background example Fill Color, Stroke Color, Stroke Width and Transparent.
- It allows you to upload Chart background image. This uploaded image can then be used in background of a Chart Div or Chart area by selecting the respective buttons.
- Support various charts type example. ine Chart, Area Chart, Stepped Area Chart, Timeline Chart, Column Charts, Combo Charts, Annotation chart, Geo Charts, Maps Charts, Candlestick Charts, Table, Scatter Chart, Gauge, Bubble Chart, Pie Charts, Slice Pie Charts etc.
- It allows you to input Charts data in various ways- Chart Data Manually,Chart Data from CSV, Chart Data Existing Database and Chart Data Other Database.
- Settings options for Padding, position, tool tip style, point value styles etc are available so as to make the input more streamlined.
- Ability to add various controls on Chart Axis Parameters example Label Title, Value Title, Series Name, Apply color to each Series Name value etc.
- It allows you to show your data from existing database table on the Live Chart and Chart Data will be automatically refresh and update after a given specific time interval.
- Option to show / hide download or print chart at front end.
- Option to show / hide social sharing buttons example. Twitter, Linkedin or Facebook etc.
- Picks data continuously from dynamic csv getting data from external source.
- Allows you to use dynamic variables ( GET / POST & logged-in User ID) in your custom MySql queries.
- The vChart component can be easily translated into any language. French, Russian, Spanish, Polish, Italian, etc.
نوشتن دیدگاه